This documentation is for frevvo v10.0. Not for you? Earlier documentation is available too.
Operational Reports for Business Insights
- Former user (Deleted)
- Megan Ellis
frevvo provides visibility into your overall system to allow tenant administrators and users with the frevvo.Reports role the ability to easily monitor forms and workflows. The frevvo Report feature provides operational reports that show:
- Active processes.
- Users involved in active processes.
- Operational errors that may have ended an active process.
- Recently completed processes.
- "Bottlenecks" that may prevent processes from completing successfully.
- Task completion time per user.
The Report feature uses the Solr and Insight software which is included in the frevvo tomcat bundle. Insight is a web app that deploys in the tomcat bundle as a war. The war contains a batch process that extracts the latest submissions from frevvo and creates Solr Documents for them. This makes your submission data available to the Operational Reports.
Submission details can be viewed by users with the proper permissions from the submission repository UI page.
On This Page:
Who can access Operational Reports?
Operational reports are available to tenant administrators and users assigned the frevvo.Reports role. The Reports display submission data for one tenant. The four types of Reports that are available are:
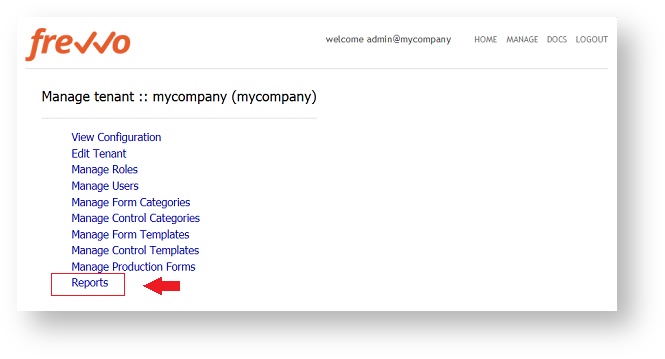
Follow these steps to access\manage the Reports. (Refer to the Access Control topic for more information.)
- Log in (must be tenant admin or a user with the frevvo.Reports role assigned)
- Click the Reports link.
Operational Reports
Active Processes Report
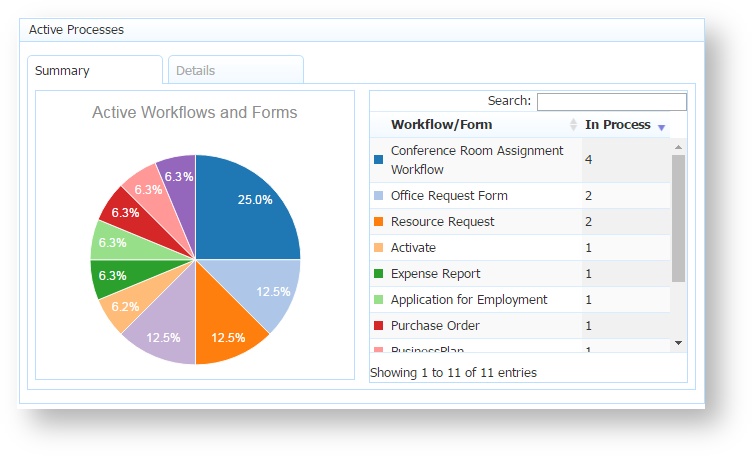
The Active Processes report displays information about workflows and forms that are active in the tenant. Active workflows are workflow instances that are started, but have not yet been submitted. Active forms are those that have been saved to the Task List and have not been submitted.
When you access the Active Processes Report, the Summary tab displays.
The Summary tab is divided into two sections:
- A pie chart showing the distribution of the top 9 active processes (by count). The first column in the chart shows a color for each Active Process that matches the color in the pie chart. Active Processes greater than 9 will all have the same color in the legend.
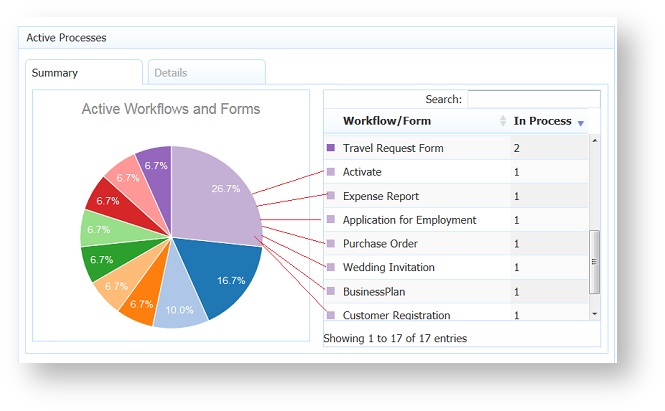
- The table to the right, shows the actual counts for each active process.
- On some Report views, you may have to click the
 plus icon to display the data.
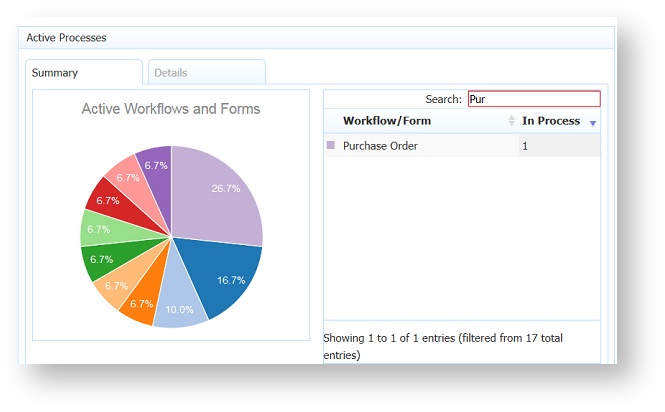
 - The Search field at the top acts as a filter. Type search criteria into the field to narrow the data display to only the data that matches. To remove the filter, clear the search field. For example, to see how many Purchase Orders are active, type Purchase Order into the field. You may only have to type a partial string before the results display.
The Details tab displays data for all of the active form/workflow instances in the tenant. A maximum of 2000 records will be displayed in the table. Clicking on any of the column titles will sort the data in ascending/descending order respectively. On some Report views, you may have to click the plus icon to display the form/workflow state column.
There are columns for:
- The Form/Workflow name
- The time and date that the active process began.
- The current user/role that the form/workflow is assigned to.
- The current state of the form/workflow.
This is the data that is summarized on the Summary tab. For example, if a particular form/workflow had a count of 3 on the Summary tab, then there would be 3 rows for it in the Details tab.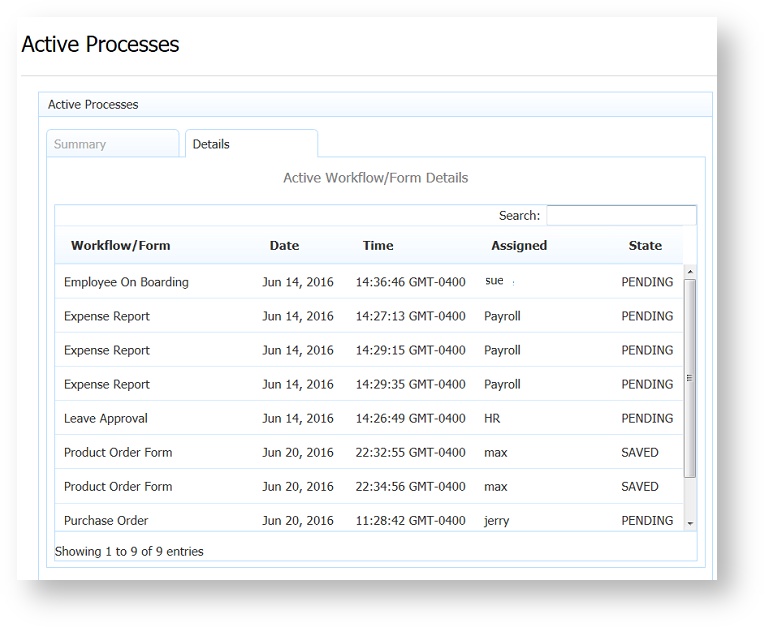
Analysis of the table shows the tenant admin that one Employee On Boarding workflow is pending approval from user sue, 3 Expense Reports are pending approval from someone in the Payroll department, 1 Request for time off (Leave Approval) is pending review by someone in HR, 2 Product Order forms are saved to user max's Task List and 1 Purchase Order is pending approval from the user, jerry.
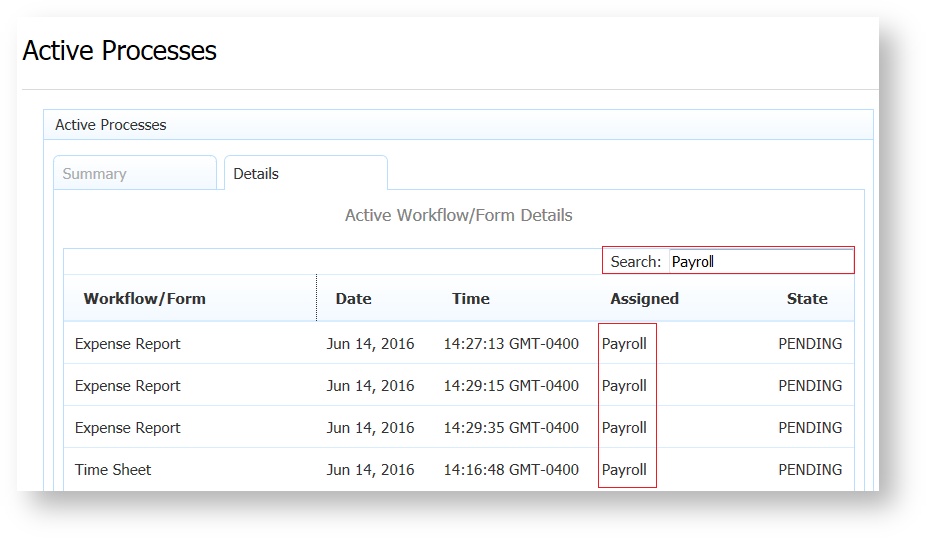
- To narrow the results, the Search field at the top acts as a filter. Type search criteria into the field to display only the data that matches. To remove the filter, clear the search field. For example, to view the active processes pending review by the Payroll department, type Payroll into the field. You may only have to type a partial string before the results display.
- Clicking on any of the column titles will sort the data in ascending/descending order respectively.
- On some Report views, you may have to click the
 plus icon to display the data.
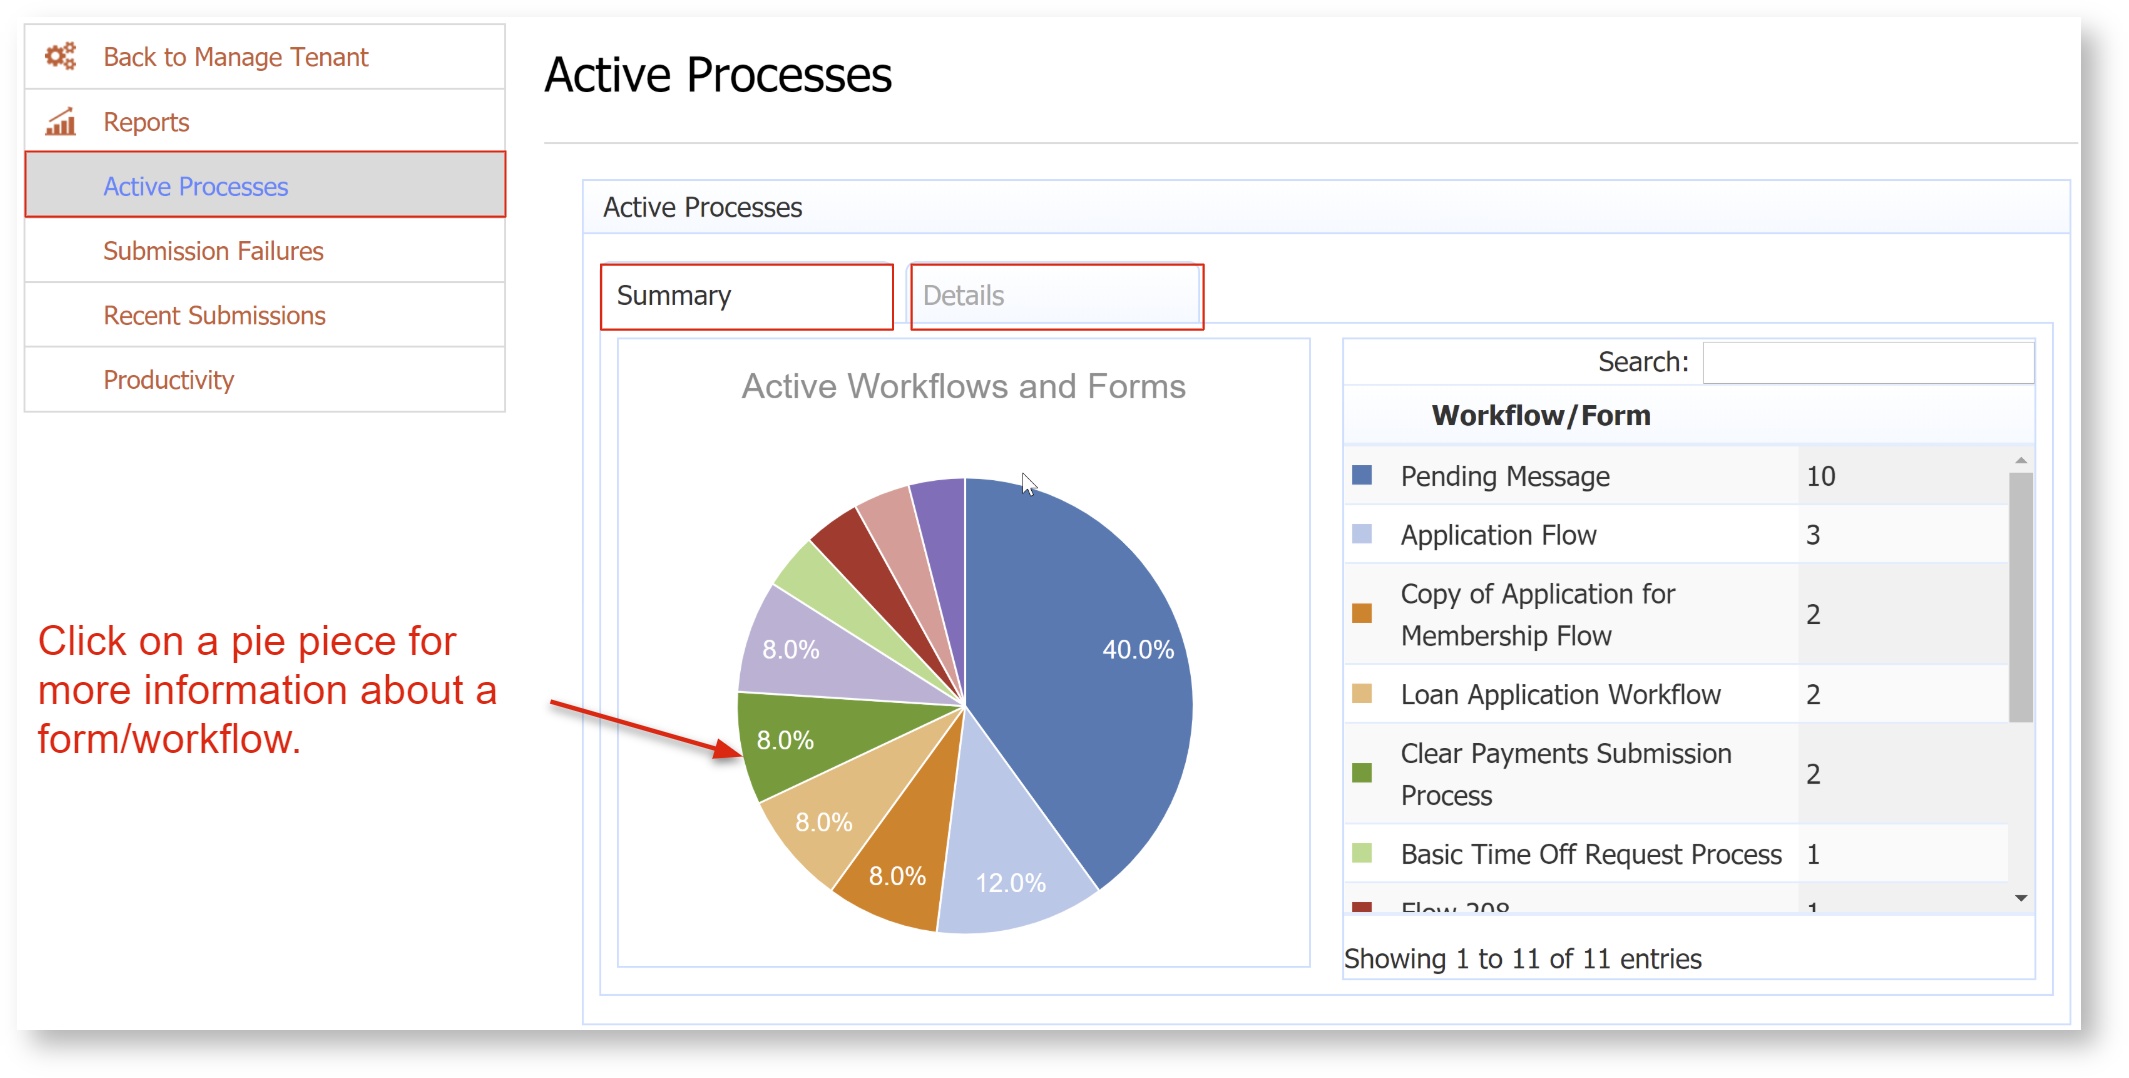
- Click or touch on a pie chart "piece"
- Click or touch a row in the table.
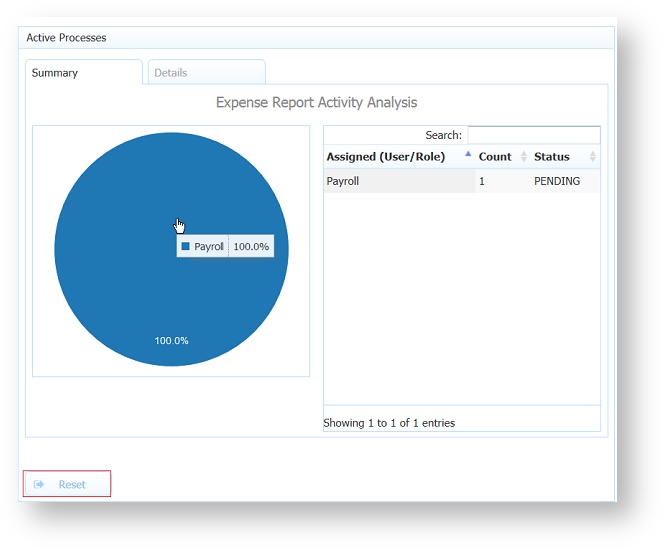
When drilling down on a particular form/workflow, the report changes to display data only about that selected form/workflow as illustrated below. At this level, the report displays information about users that currently have assigned tasks for the selected workflow. The pie chart displays the percentage break down and the table to the right displays the summarized counts of assignments per user and status. Hovering over the pie chart shows the assigned user/roles and the percentage breakdown. On some Report views, you may have to click theplus icon to display the form/workflow state column.
The Reset button can be used to go back to the mode of showing data for all active processes. Think of it as "going back up".
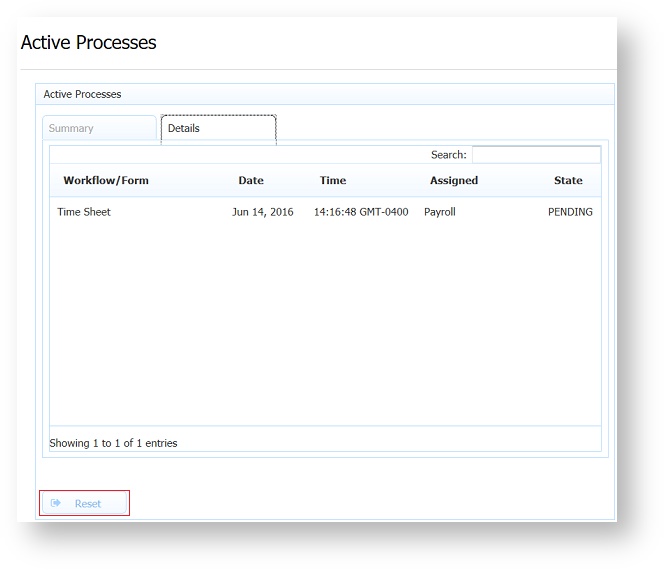
Clicking the Details tab after drilling down, displays information for each active instance of the selected form/workflow type. On some Report views, you may have to click the plus icon to display the data.
Submission Failures Report
The Submission Failures Report displays information about any workflow instances (or forms) in the tenant where an error occurred during submission. There are many possible causes of errors upon submission and it is critical to spot them early and correct them as soon as possible. This report can be used to determine if there have been recent errors and to investigate the exact causes.
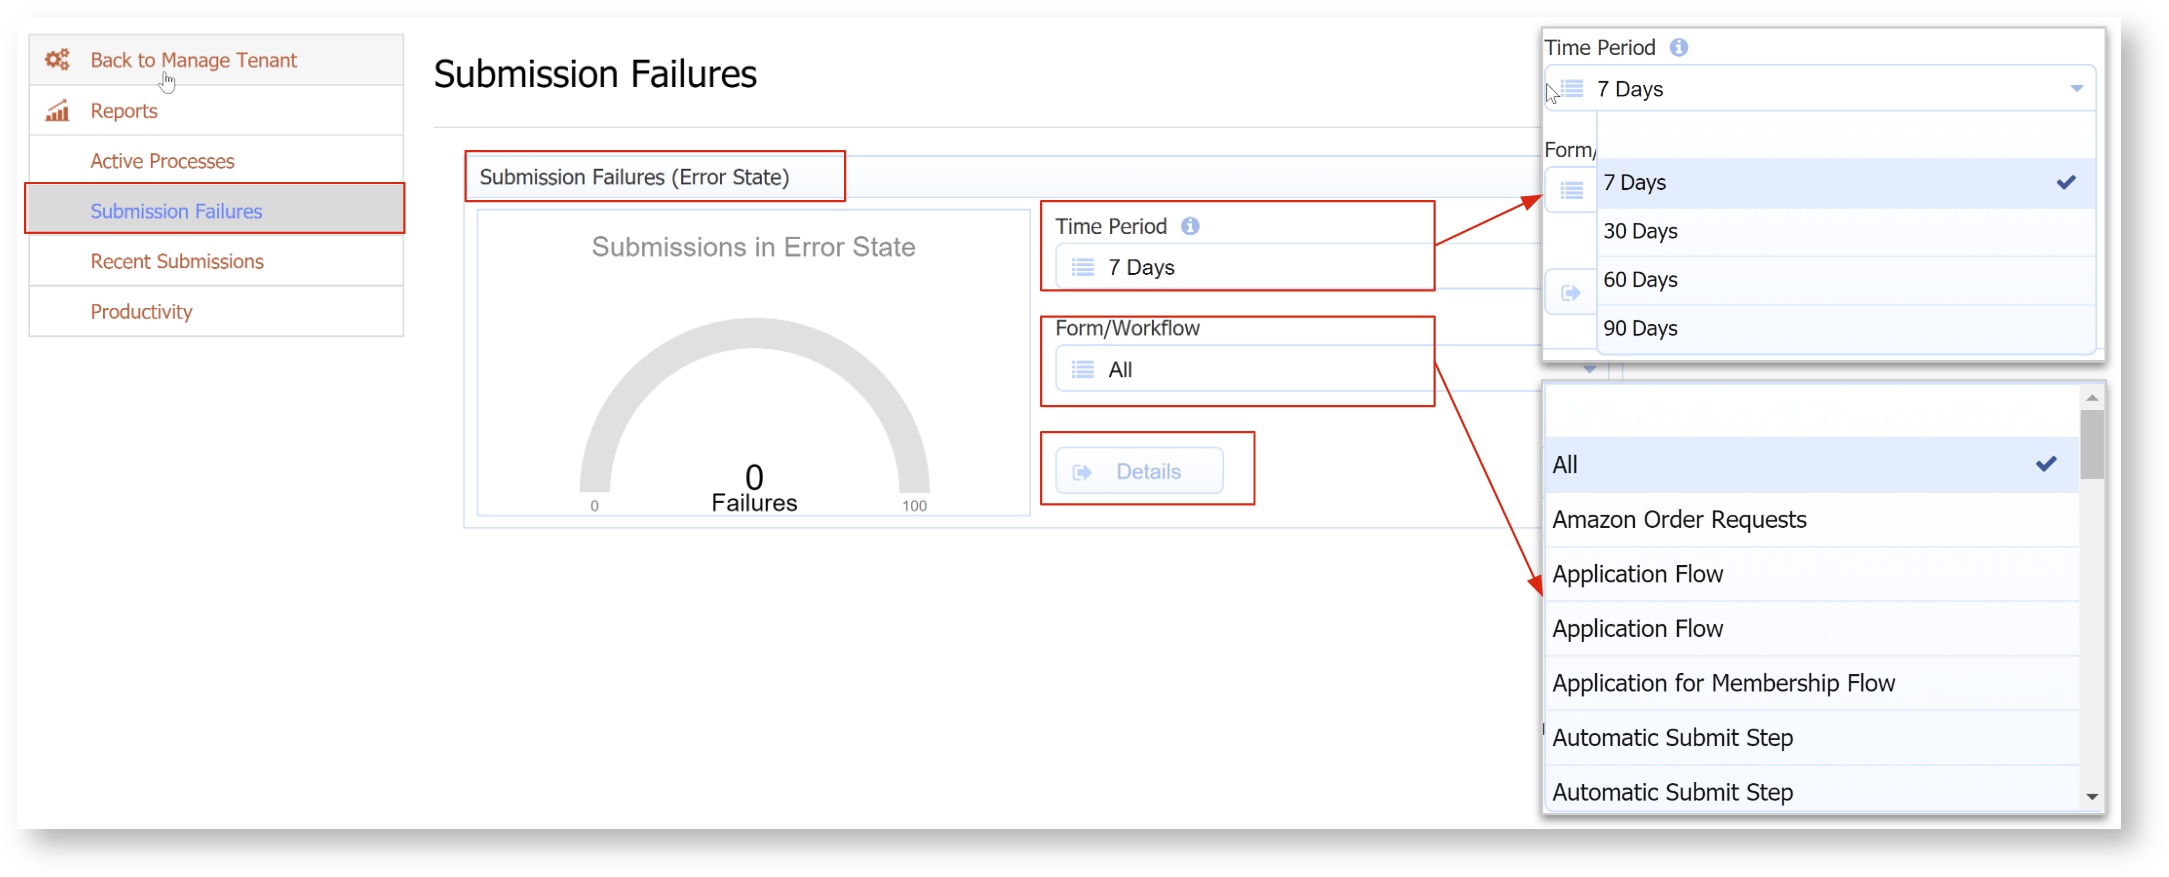
The Submission Failures report initially shows all error data for a tenant for the last 7 days displayed on a simple radial gauge control. The number of submission failures is shown and is represented on the radial gauge control by the red color. You can change the values for this report to view the information you are interested in.
- Change the Time Period - the number of days you want to look-back for submission errors from the default value of 7 to 30, 60 or 90 days by selecting the value from the dropdown.
- You can choose to search all forms/workflows or drill down to a particular form/workflow by selecting it from the Form/Workflow dropdown.
- Select the Details button in the initial view to drill down on the selected time period and selected form/workflow. Clicking on the gauge does not drill down.
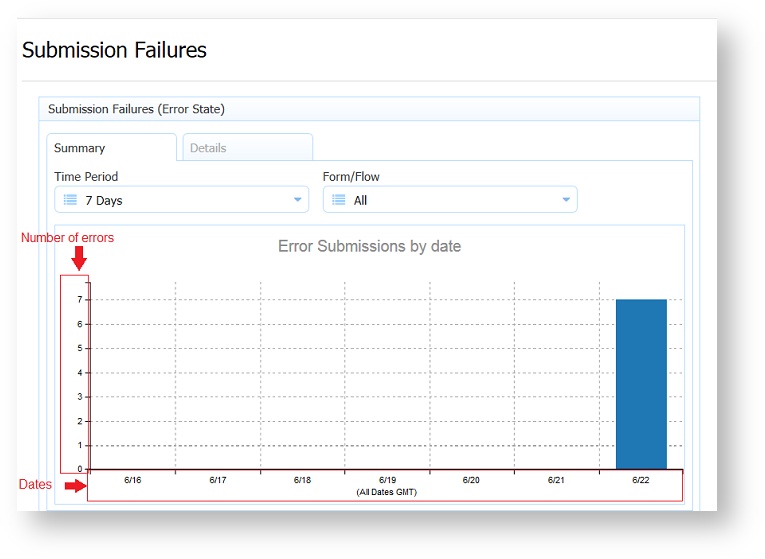
When you select the Details button in the initial view, the report displays a Summary and another Details tab.
- The Summary tab is selected by default and displays a chart for the last x days (depending on time period chosen). For each date, the chart shows the count of submissions with errors (i.e. failed submissions). The image of the Submission Failure report below shows 7 frevvo submissions with errors for 6/22/16. All dates are GMT days, not local timezone days.
- You can change the Time Period and select a specific Form/Workflow from the dropdowns on the Summary tab.
- On some Report views, you may have to click theplus icon to display the data.
- To view to the details behind the data on this chart, select the Details tab. The bars in this graph are not clickable.
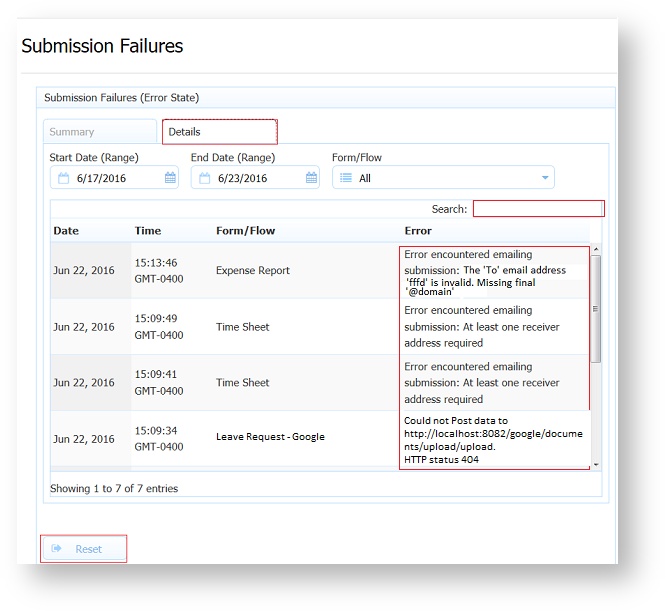
The Details tab in this view displays a table with information about each failed submission. A maximum of 2000 records will be displayed in the table. Clicking on any of the column titles will sort the data in ascending/descending order respectively. On some Report views, you may have to click the plus icon to display the error text.
- Each item contains the exact error description/text so that the administrator can determine what is causing the error and take action.
- The Date and Time for the error submission is displayed in the local timezone..
- Start and End date fields and the Form/Workflow field can be altered to view more/less data. All dates are displayed in the GMT timezone.
- The Search field at the top of the table acts as a filter. Anything typed in the search field is checked against all the data in each row and only rows that have matching data are displayed. To remove the filter, clear the Search field.
- Clicking the Reset displays the initial view of the Report.
Recent Submissions Report
The Recent Submissions Report displays information about all recently submitted (completed) workflow instances or forms in the tenant. This report is used to get a quick picture of completed submission activity and overall system usage.
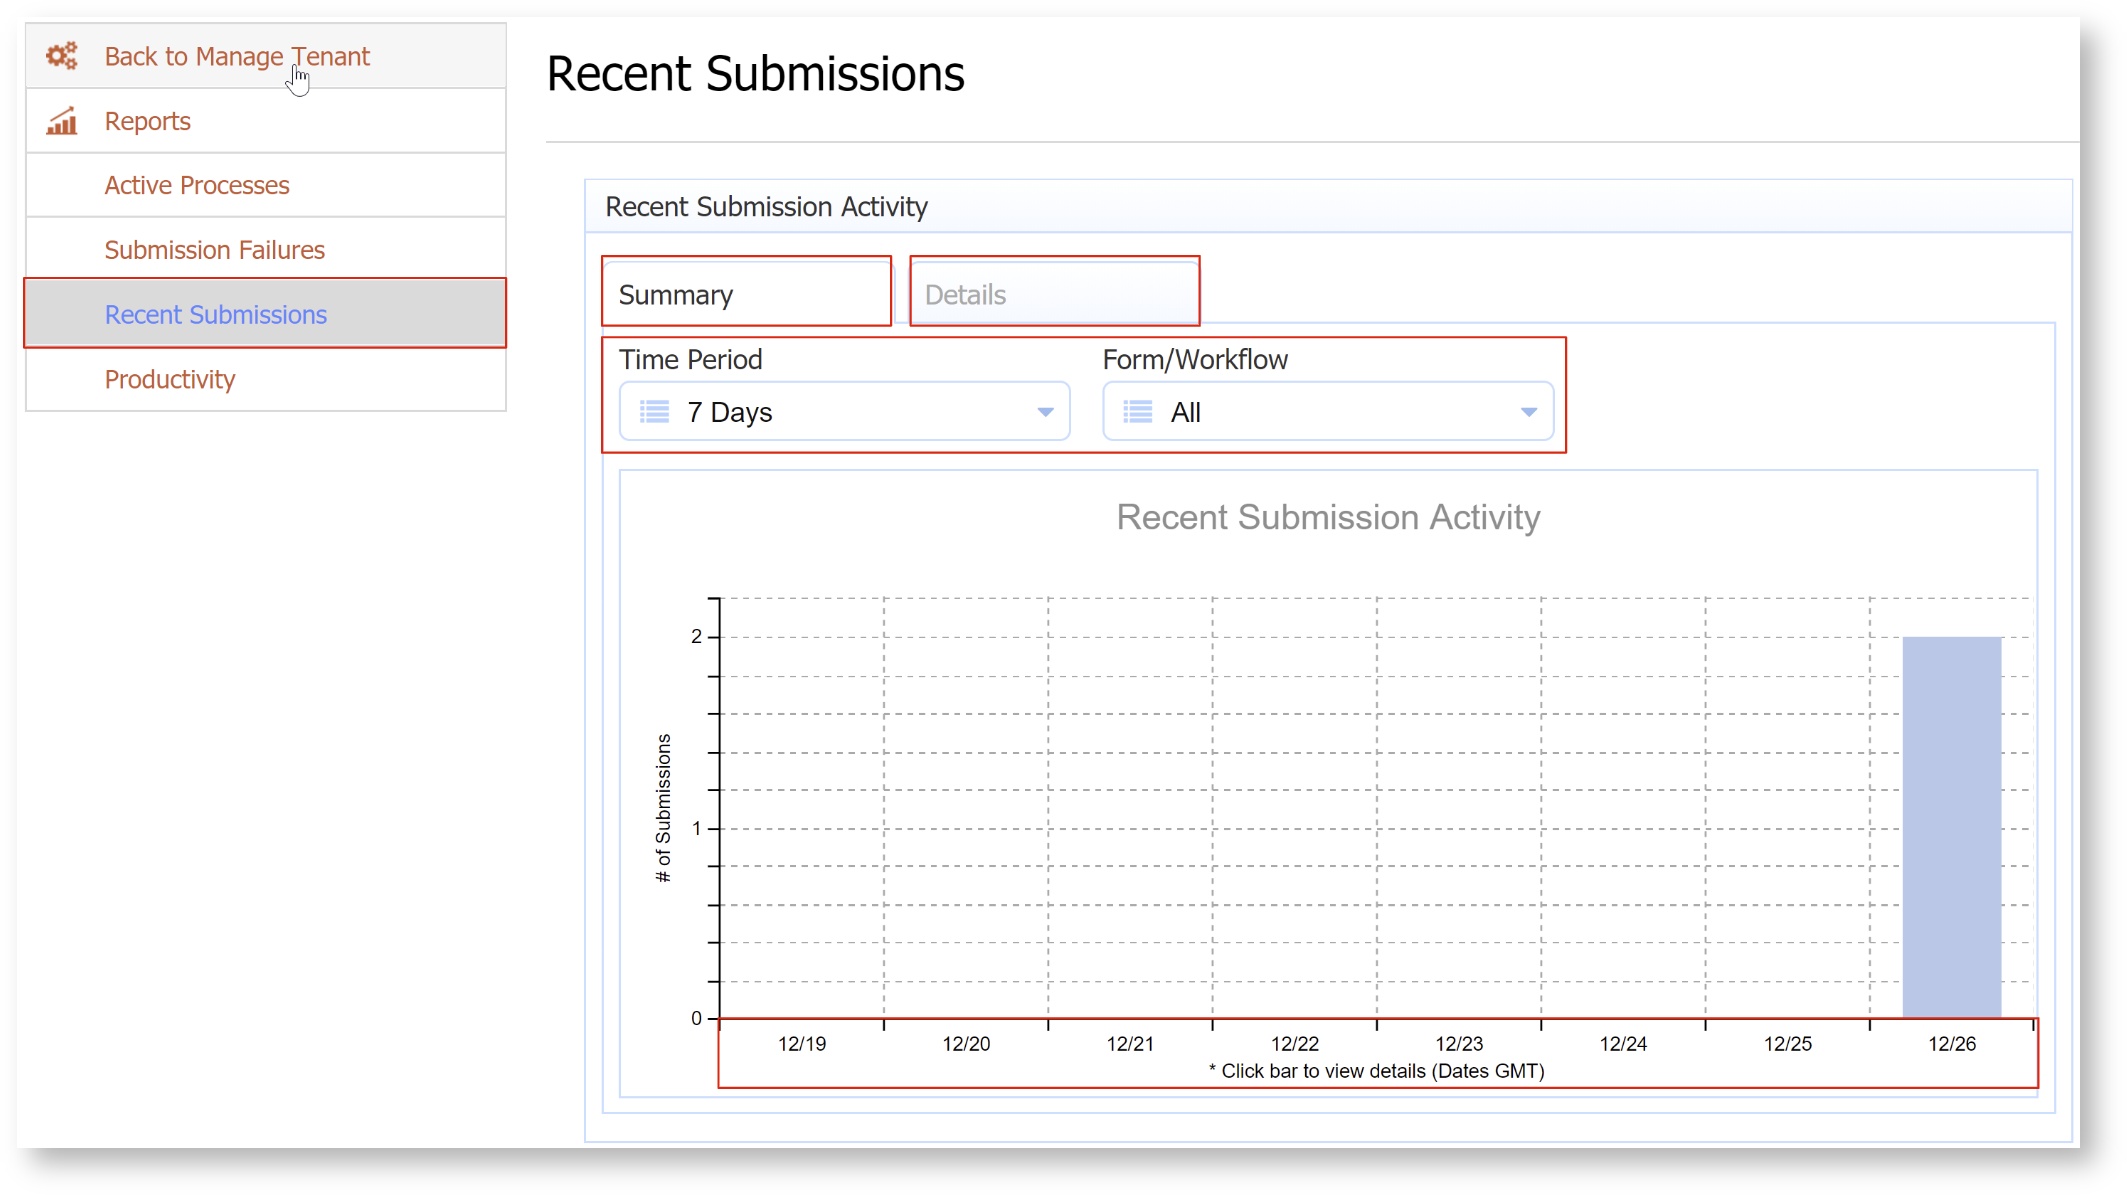
The Recent Submissions Report initially displays a chart for the last 7 days with the total count of (completed) submissions for each day for all form/workflow types.
- The time period (7, 30, 60 and 90 days) and selected form/workflow can be changed, causing the chart to update.
- Submissions on the bar chart are grouped into GMT days, not local timezone days.
- Click/touch a bar on the chart to drill-down into the data for that date. On some Report views, you may have to click the plus icon to display the number of submissons.
- Click the Details button to see the submission data presented in a table.
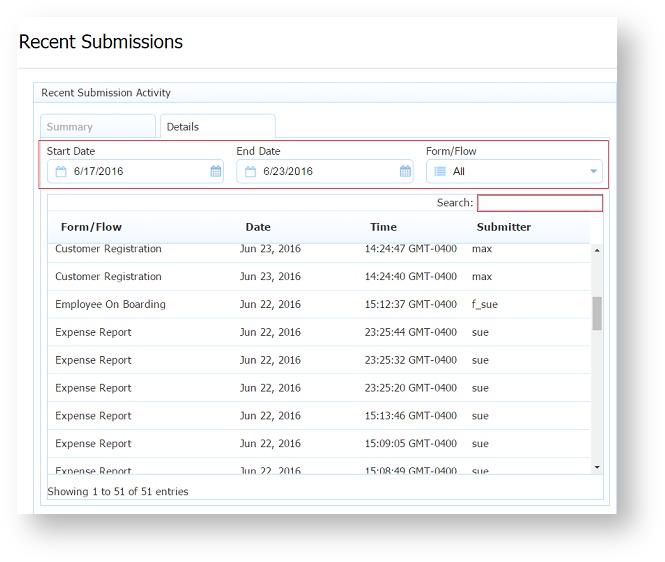
The table on the Details tab displays submission data for the selected date range and the selected form/workflow. This is the detailed data that is summarized on the summary tab. A maximum of 2000 records will be displayed in the table.
- The Start/End dates and selected form/workflow are synchronized to that selected initially on the summary tab. The user can then change them to examine other sets of data.
- The Search field at the top of the table acts as a filter. Anything typed in the search field is checked against all the data in each row and only rows that have some data that matches are displayed. To remove the filter, clear the Search field.
- Clicking on any of the column titles will sort the data in ascending/descending order respectively.
- There is no drill-down available from here.
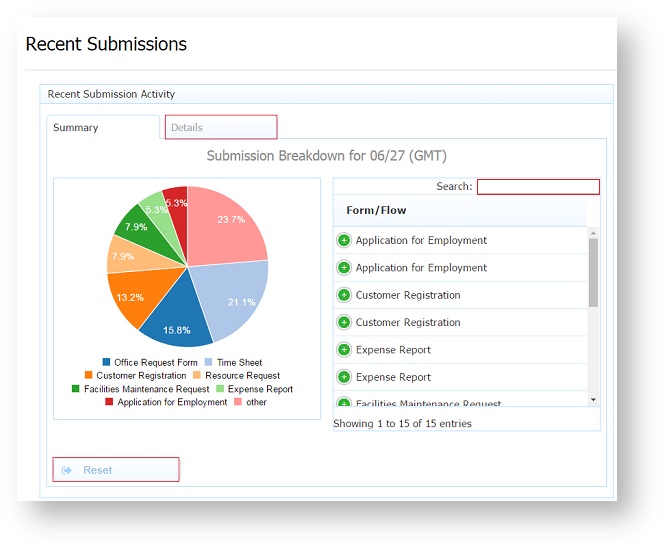
Clicking a bar on the Recent Submissions Activity chart, displays a pie chart and table representing the submissions for that date broken down by form/workflow type.
- The pie chart shows the data broken down by percentage for the top 9 form/workflow types (with the greatest number of submissions) with all else grouped into the other category.
- The table to the right represents the same data, but shows the actual counts and also expands on the other category.
- On some Report views, you may have to click the plus icon to display the number of submissions.
- Clicking the Reset button returns to the bar graph.
Clicking on the Details tab, displays the data in chart form.
- Start and End date fields and the Form/Workflow field can be altered to view more/less data. All dates are displayed in the GMT timezone.
- Clicking on any of the column titles will sort the data in ascending/descending order respectively.
- Click the Summary tab to return to the pie chart view.
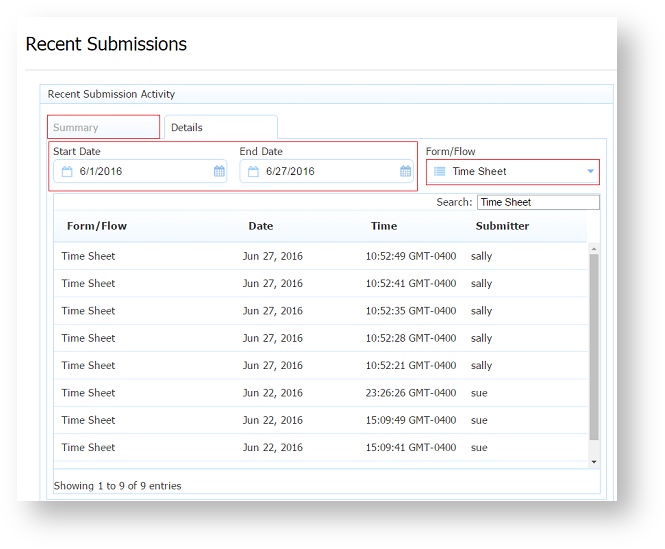
The image below shows the completed submissions from 6/1/16 - 6/27/16 for the Time Sheet workflow. The columns displayed are:
- Form/workflow name
- Date of the completed submission in the local timezone.
- Time of the completed submission in the local timezone.
- The user who submitted it.
Productivity Report
The Productivity Report shows performance statistics for workflow processes only. Form data is not included in these reports. This is as designed. The information for workflows includes:
- statistics on workflow durations, including average and maximum time for submissions.
- statistics on the performance of workflow types by individual users/approvers, including their average processing times, etc.
This report allows the administrator to get an understanding of the throughput and productivity of the team involved in their processes. For example, "bottlenecks" and under utilization of human resources can be visualized.
The report initially displays a breakdown of the average and maximum durations of each workflow type for the previous 30 days. This data only takes into account workflows that completed within the time period (last 30 days) and does not include incomplete workflows nor workflows with zero duration.
- Examine different data sets by selecting a time frame from the Time Period dropdown. The choices are 30, 60, 90, 120 days or 1 year.
- The data is organized initially left to right with workflows with greatest average durations to the left and descending to the right.
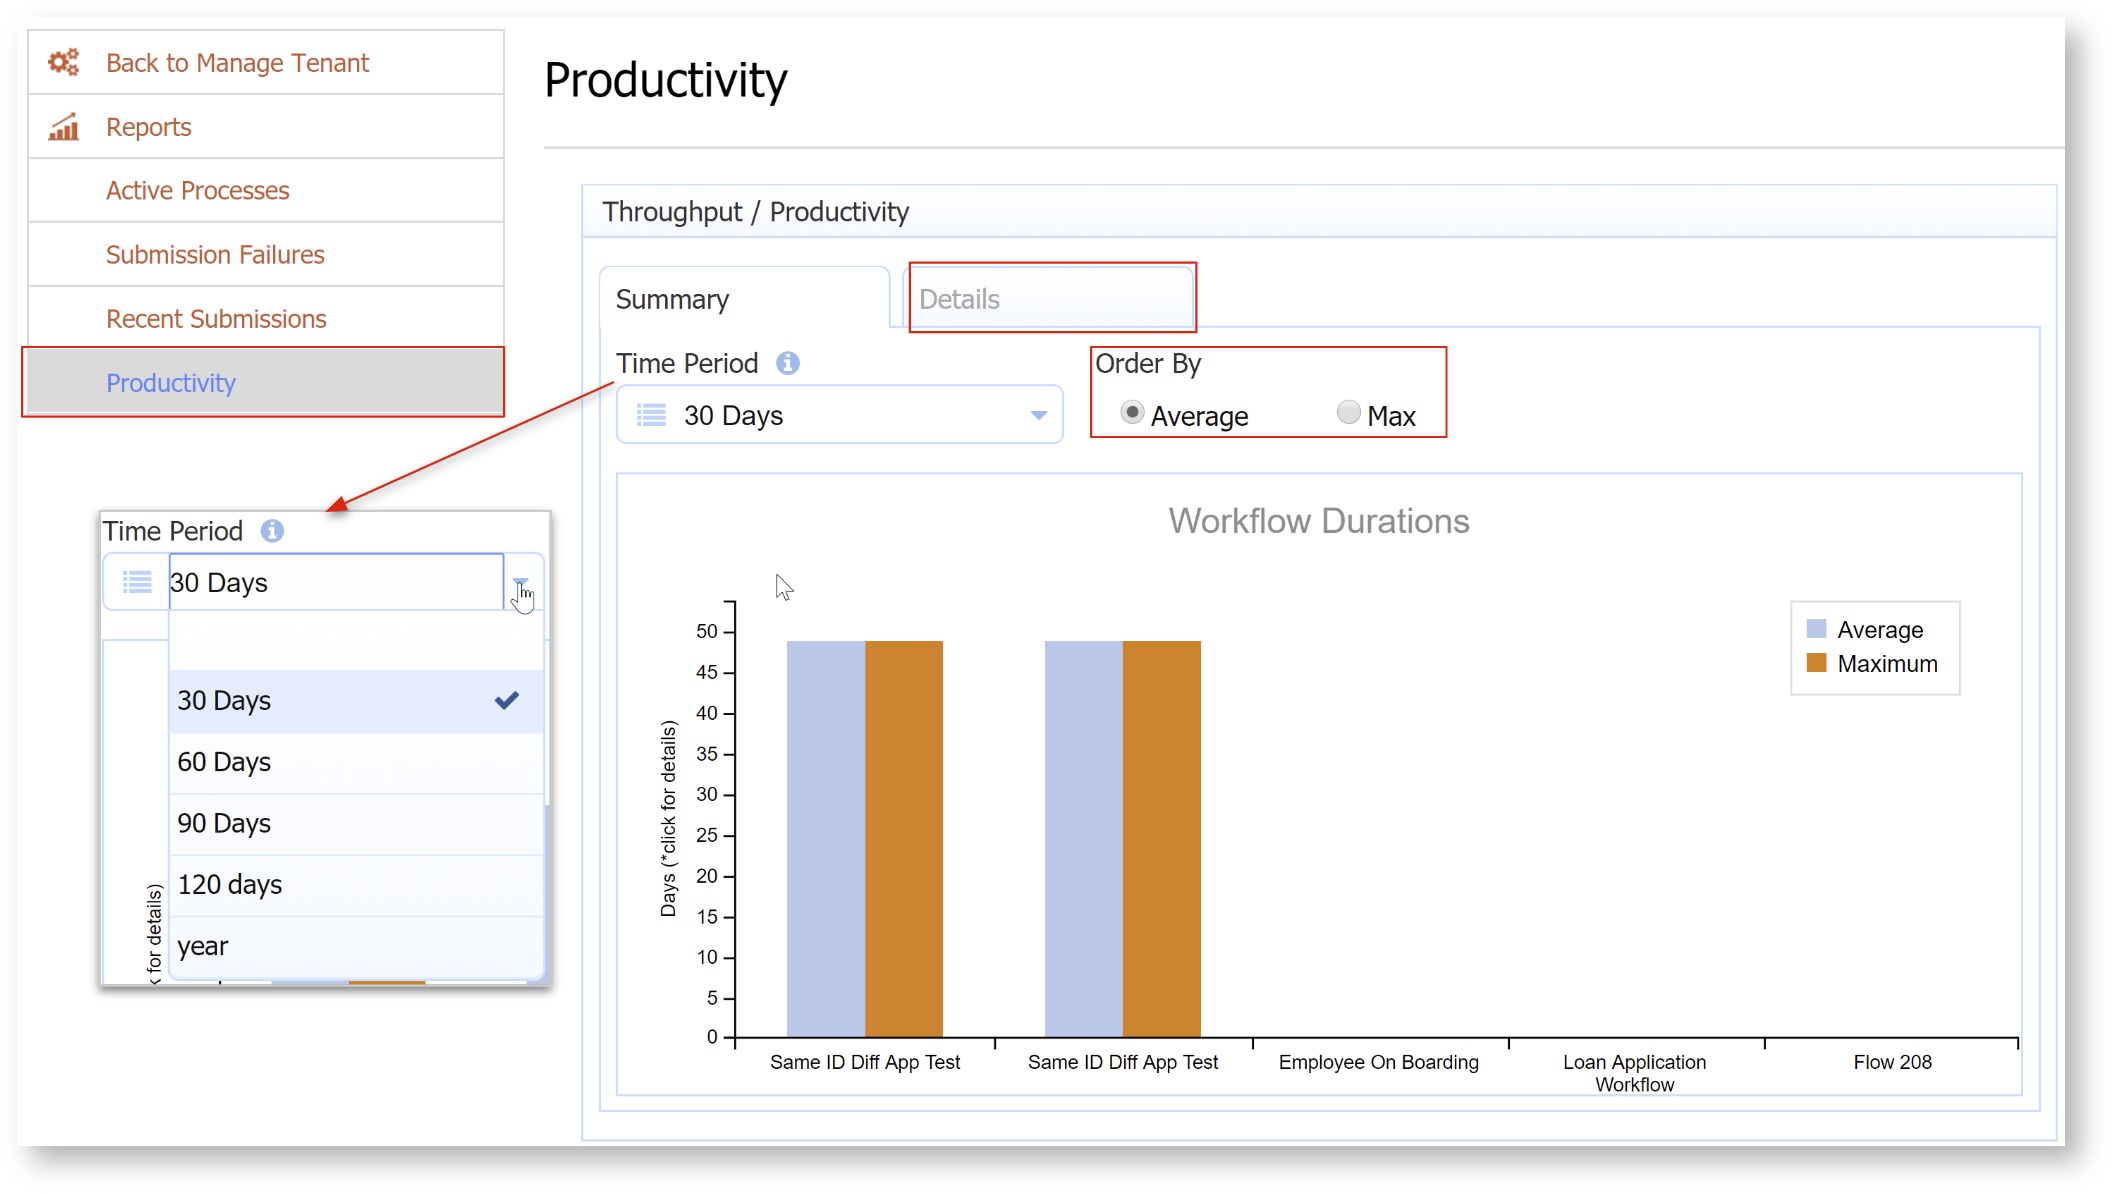
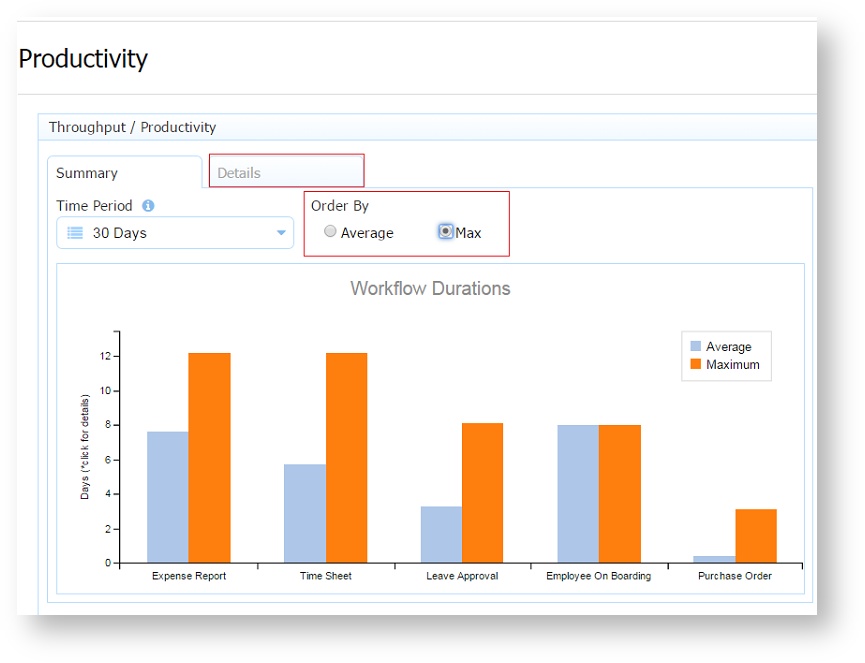
- The data can be ordered by max duration in descending order by checking Max in the Order By radio button.
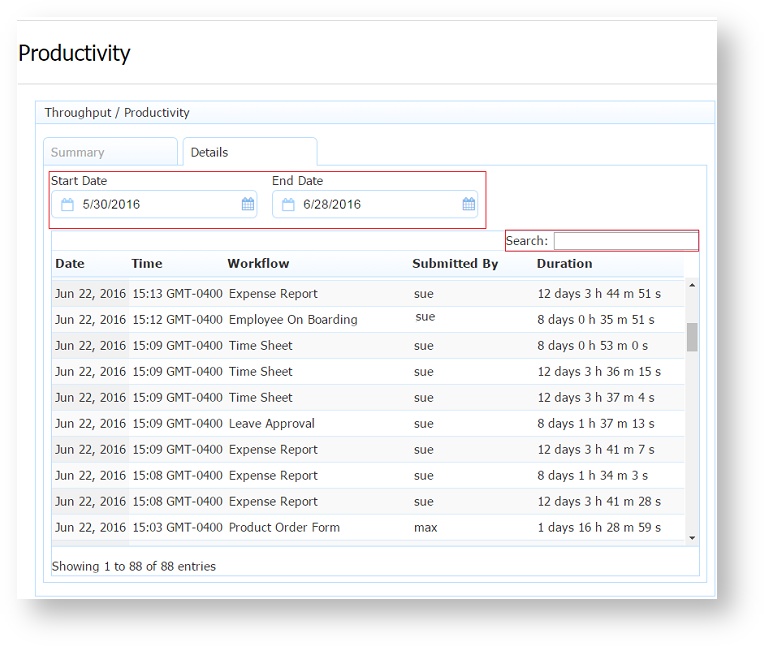
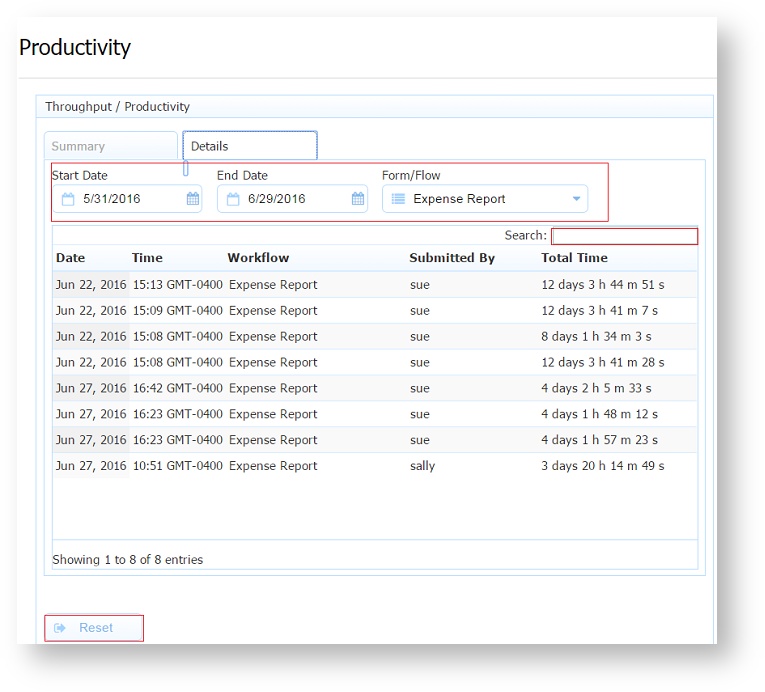
- The Details tab displays detailed completed submission data for all workflows for the selected date range. This is the detailed data that is summarized on the Summary tab. A maximum of 2000 records will be displayed in the table. Clicking on any of the column titles will sort the data in ascending/descending order respectively. This report displays:
- the Date/Time of the submission.
- the Workflow name
- the user who submitted the completed workflow task
- the Duration for the completed submission.
- The Start/End dates are synchronized to that selected initially on the summary tab. The user can then change them to examine other sets of data.
- The table has a Search field that acts as a filter. Anything typed in the search field is checked against all the data in each row and only rows that have some data that matches are displayed. To remove the filter, clear the search field.
- There is no drill-down available from here.
- Click the Summary tab to return to the default view.
Productivity Time Reports - Time Stats
Clicking a bar from the initial display of the Workflows Duration chart displays the Time-Stats report. There are two reports that can be used to examine the processing time of individual participants/approvers of a particular workflow:
- Time Stats (shown initially)
- Time Breakdown.
The Time Stats chart displays average and max processing for the users/approvers involved in the selected workflow. The time period and form/workflow are carried forward from the initial screen, but the user may change this to examine other data.
The Time Breakdown chart is available by checking the Time Breakdown option of the Show radio button.
Both chart types only show data for individual workflow types. If "all" is selected, then no data will be displayed.
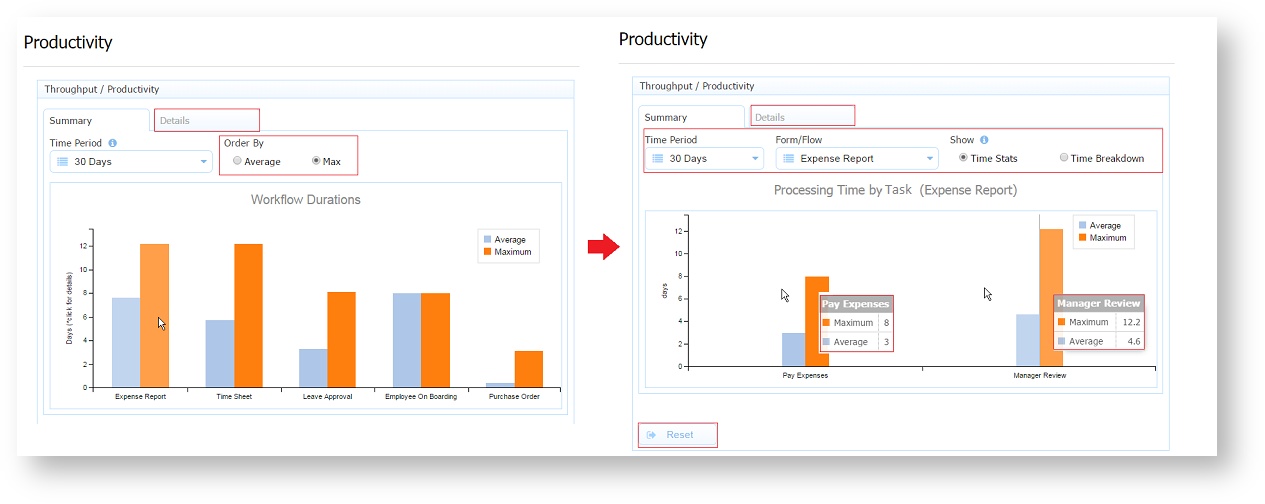
For example, the Time Stats Report shown above, displays the average and maximum number of days for the Manager Review and Pay Expenses steps of the Expense Report workflow for a period of 30 days.
Designers should be aware that this report shows information for the individual steps in a workflow. Naming the steps appropriately when designing a workflow will eliminate confusion when viewing the report.
- Examine different data sets by selecting a time frame from the Time Period dropdown. The choices are 30, 60, 90, 120 days or 1 year.
- Hover over any of the bars to see a tooltip that displays the Maximum and Average times for that step.
- Click the Details tab to see
- the Date/Time of the submission.
- the Workflow name
- the user who submitted the completed workflow task
- the Total Time for the completed submission.
- Clicking on any of the column titles will sort the data in ascending/descending order respectively.
- The Start/End dates and the Form/Workflow can be changed from this screen to examine other sets of data.
- Clicking the Reset button takes you back to the Workflow Durations chart.
- On some Report views, you may have to click the plus icon to display the data.
- The table has a Search field that acts as a filter. Anything typed in the search field is checked against all the data in each row and only rows that have some data that matches are displayed. To remove the filter, clear the search field.
Productivity Time Reports - Time Breakdown
The data for individual workflows can be drilled into by clicking/touching the chart bar(s) for a particular workflow type on the Workflow Duration chart.
The Time Breakdown chart for the tasks involved in a particular workflow type presents results for "tasks" with durations.
- Check Time Breakdown on the Show radio button to display the report.
- The processing times for participants/approvers involved in the workflow type are "bucketed" into categories:
- < 1 day,
- 1-3 days
- 3-5 days
- 5-10 days
- ≥ 10 days
- The counts of workflow instances of that type (completed in the time period) for each of those buckets is presented as a sort of histogram. In this way, the administrator can visualize bottlenecks in the approval process. It should be possible to get an idea of which users are under/over utilized, etc.
Hover over any of the bars to see a tool tip that displays the number of tasks performed during that processing time.
Designers should be aware that the tool tips in this report refer to the individual tasks involved in a workflow. Naming the steps appropriately when designing a workflow will eliminate confusion when viewing the report.
- The Time Period dropdown can be changed from this screen to examine other sets of data.
- Clicking the Reset button takes you back to the Workflow Durations chart.
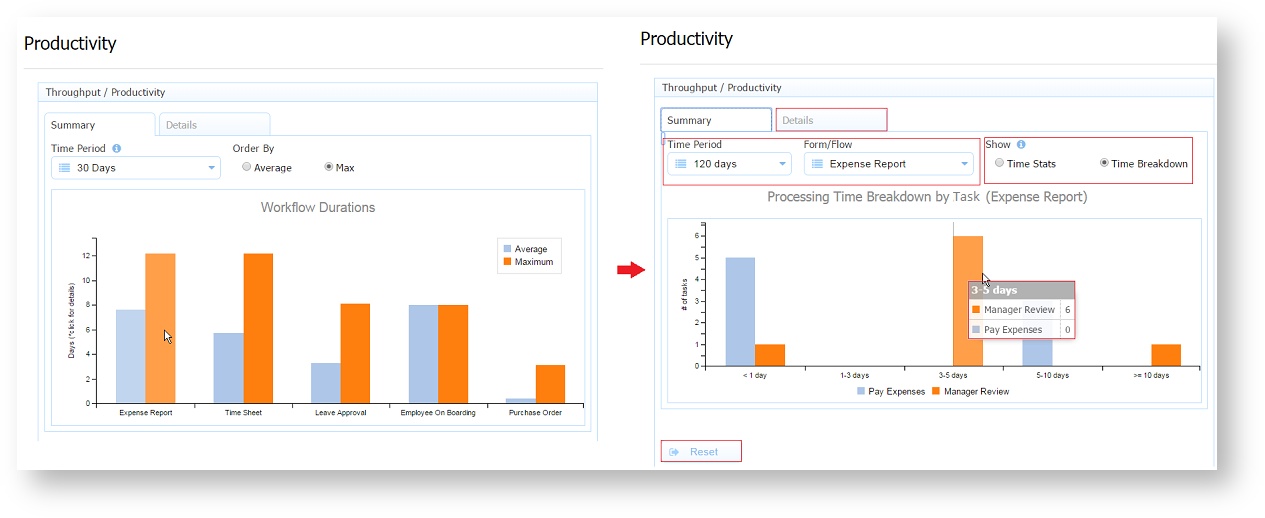
For example, the tenant admin can quickly see that 6 Manager Review tasks were performed within 3 - 5 days while one took at least 10 days.
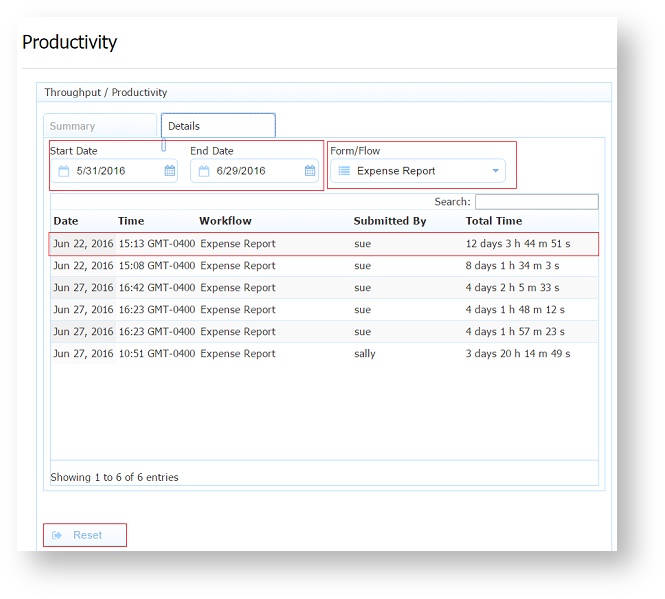
- Click the Details tab to see detailed completed submission data for the selected form/workflow for the selected date range. This is the detailed data that is summarized in either the Time Stats or the Time Breakdown chart on the summary tab. This report displays:
- the Date/Time of the submission.
- the Workflow name
- the user who submitted the completed workflow task
- the Total Time for the completed submission.
- Clicking on any of the column titles will sort the data in ascending/descending order respectively.
- The Start/End dates are synchronized to that selected initially on the summary tab. The user can then change them or the selected form/workflow in order to examine other sets of data.
- Clicking the Reset button takes you back to the Workflow Durations chart.
- The table has a Search field that acts as a filter. Anything typed in the search field is checked against all the data in each row and only rows that have some data that matches are displayed. To remove the filter, clear the search field.
- On some Report views, you may have to click the plus icon to display the data.
Access Control
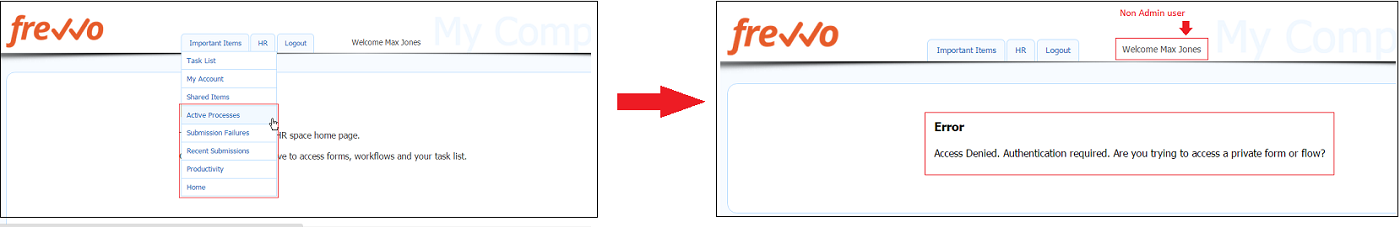
By default, operational reports in a space only display if the space is accessed by the tenant administrator. Non-admin users that log into a space on a desktop will not see the links to the Operational Reports. The designer user that created the space (space owner) will see the report links but will receive an "Access Denied. Authentication required. Are you trying to access a private form or workflow?" error message when they click on them.
However, tenant admins can assign other users the frevvo.Reports role which will allow them to view operational reports.
Assign frevvo.reports Role to a User:
1. Log-in to frevvo as a tenant admin (username admin@mycompany.com)
2. Click Manage Users in the menu on the left side.
3. Select a user (browse alphabetically or click All for a full list.)
4. Next to the user’s name, click Edit User
5. In the Role section, click the + to add a new role.
6. From the drop-down list, select the role frevvo.reports. Click Submit to save.
Now when the user logs in, they should see the Reports tab available on their home screen with the same report features that tenant admin users can view.
frevvo.Reports role restrictions
If a user with the frevvo.Reports role also has frevvo.Publisher or frevvo.ReadOnly roles assigned, the latter will take precedence and they will not see the reports tab.
Operational Reports in a frevvo Space
When a frevvo designer creates a Space, Operational Report links are inserted into the space menu by default under the Important Items menu. A specialized syntax/key word: <FREVVO_REPORTS>, inserts all 4 Operational Reports. At present, there is no way to include/exclude reports. All four are always inserted.
Editing the Space Menu displays these links when a space is created. The example shows the Space menu when a space is created in a frevvo cloud tenant. If you are an in-house customer, change app.frevvo.com:443 to <your server:port>:
* Important Items
** Task List|http://app.frevvo.com:443/frevvo/web/tn/t/subject/{subject.id}/tasks?embed=true
** My Account|http://app.frevvo.com:443/frevvo/web/tn/t/subject/{subject.id}/profile?embed=true&edit=true
** Shared Items|http://app.frevvo.com:443/frevvo/web/tn/t/subject/{subject.id}/shared?embed=true&hidenav=true
** |<FREVVO_REPORTS>
** Home|http://app.frevvo.com:443/frevvo/web/tn/t/user/eric/space/dts/home?embed=true
Notice that there is no menu item label for the |<FREVVO_REPORTS> item. It is not supported.
Customize Report Names
To customize the names of the 4 reports, follow these steps:
- Edit the Space Menu
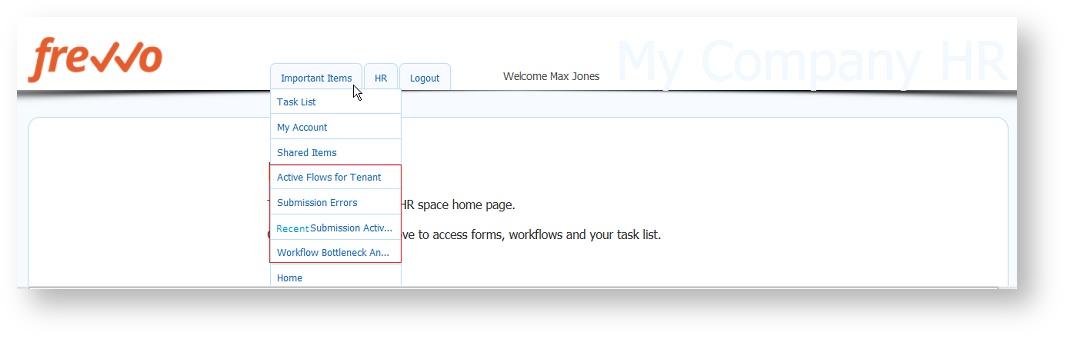
- Add the custom names for the 4 reports in front of the pipe symbol preceeding the <FREVVO_REPORTS> keyword. The first report name override is applied to the Active Processes Report, the second name override after the first pipe is applied to the Submissions Failures Report, the third name override after the second pipe is applied to the Recent Submissions Report and the fourth name override after the third pipe is applied to the Productivity Report. For example: The Reports will be named Active Workflows for Tenant, Submission Errors, Resent Submission Activity, Workflow Bottleneck Analysis if the space menu is modified as shown below.
- Save the changes to the space.
The example shows the Space menu for a frevvo cloud customer. If you are an in-house customer, change app.frevvo.com:443 to your server:port:
* Important Items
** Task List|http://app.frevvo.com:443/frevvo/web/tn/t/subject/{subject.id}/tasks?embed=true
** My Account|http://app.frevvo.com:443/frevvo/web/tn/t/subject/{subject.id}/profile?embed=true&edit=true
** Shared Items|http://app.frevvo.com:443/frevvo/web/tn/t/subject/{subject.id}/shared?embed=true&hidenav=true
** Active Workflows for Tenant|Submission Errors|Recent Submission Activity|Workflow Bottleneck Analysis|<FREVVO_REPORTS>
** Home|http://app.frevvo.com:443/frevvo/web/tn/t/user/eric/space/dts/home?embed=true
Display Reports under a Customized Tab
To display the Operational Reports under a customized tab instead of under the Important Items tab, follow these steps:
- Edit the Space Menu
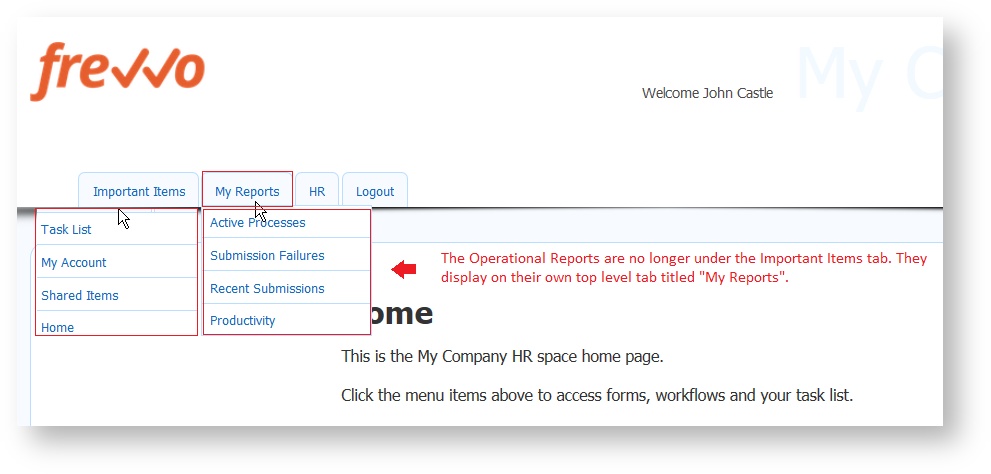
- Add the custom name for the Operational Reports in front of the pipe symbol preceding the <FREVVO_REPORTS> keyword. For example, the Operational Reports will display under a tab named My Reports if the space menu is modified as shown below.
- Save the changes to the space.
The example shows the Space menu for a frevvo cloud customer. If you are an in-house customer, change app.frevvo.com:443 to <your server:port>:
* Important Items
** Task List|http://app.frevvo.com:443/frevvo/web/tn/t/subject/{subject.id}/tasks?embed=true
** My Account|http://app.frevvo.com:443/frevvo/web/tn/t/subject/{subject.id}/profile?embed=true&edit=true
** Shared Items|http://app.frevvo.com:443/frevvo/web/tn/t/subject/{subject.id}/shared?embed=true&hidenav=true
** Home|http://app.frevvo.com:443/frevvo/web/tn/t/user/eric/space/dts/home?embed=true
* My Reports|<FREVVO_REPORTS>
Change Report Names and Display them under a Customized Tab
To display the Operational Reports under a customized tab with modified names, follow these steps:
- Edit the Space Menu
- Add a single asterisk followed by the name of the tab.
- On the next line add the custom names for the Operational Reports in front of the pipe symbol preceding the <FREVVO_REPORTS> keyword. This will work with or without the double asterisks in front of the line to change the Report names.
- Save the changes to the space.
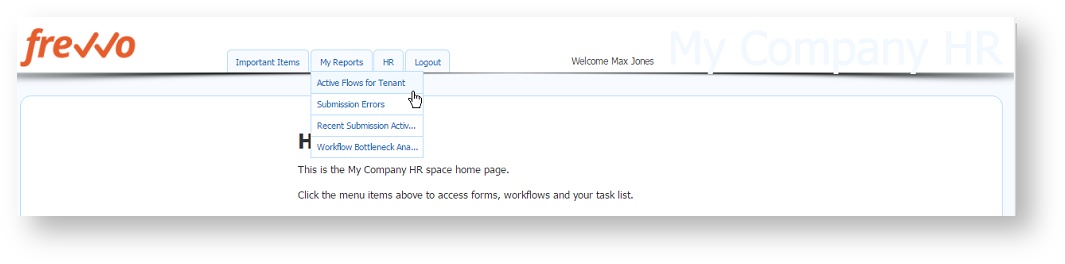
The example shows the Space menu for a frevvo cloud customer. If you are an in-house customer, change app.frevvo.com:443 to <your server:port>. The Operational Reports will display under a tab named My Reports if the space menu is modified as shown below.
* Important Items
** Task List|http://app.frevvo.com:443/frevvo/web/tn/t/subject/{subject.id}/tasks?embed=true
** My Account|http://app.frevvo.com:443/frevvo/web/tn/t/subject/{subject.id}/profile?embed=true&edit=true
** Shared Items|http://app.frevvo.com:443/frevvo/web/tn/t/subject/{subject.id}/shared?embed=true&hidenav=true
** Home|http://app.frevvo.com:443/frevvo/web/tn/t/user/eric/space/dts/home?embed=true
* My Reports
Active Flows for Tenant|Submission Errors|Recent Submission Activity|Workflow Bottleneck Analysis|<FREVVO_REPORTS>
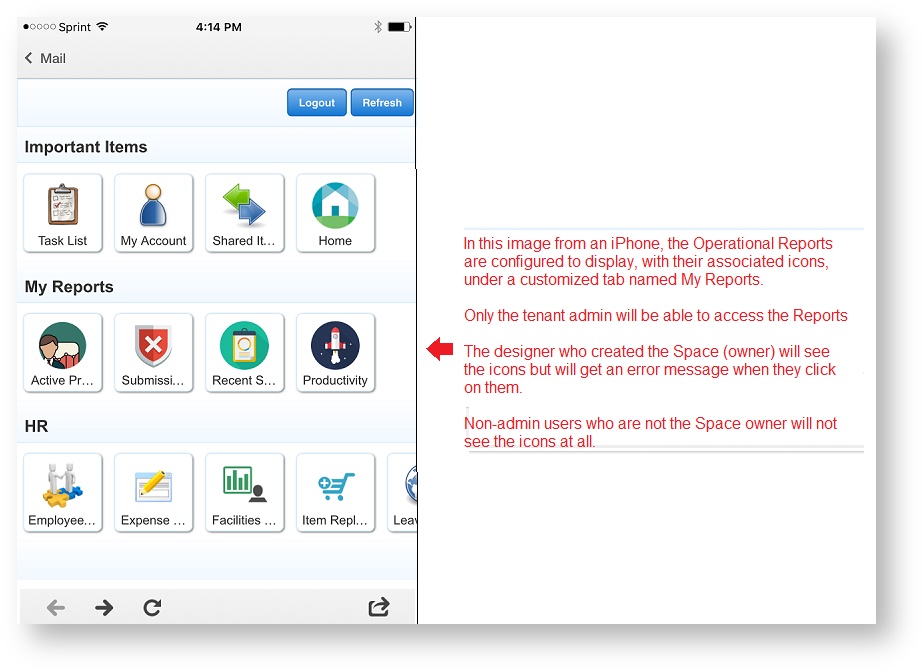
Operational Reports on Mobile Devices
In this image from an iPhone, the Operational Reports are configured to display, with their associated icons, under a customized tab named My Reports. The icons cannot be changed.
- Only the tenant admin and users assigned the frevvo.Reports role will be able to access the Reports.
- The designer who created the Space (owner) will see the icons but will get an error message when they click on them.
- Non-admin users who are not the Space owner will not see the icons at all.